Training: Data Entry Guide: PFM Reporting Framework
General Guidance
Setup of the Workbook
- Instructions, Definitions, Framework Tabs: The first three tabs of the workbook include key instructions, definitions, and the conceptual framework.
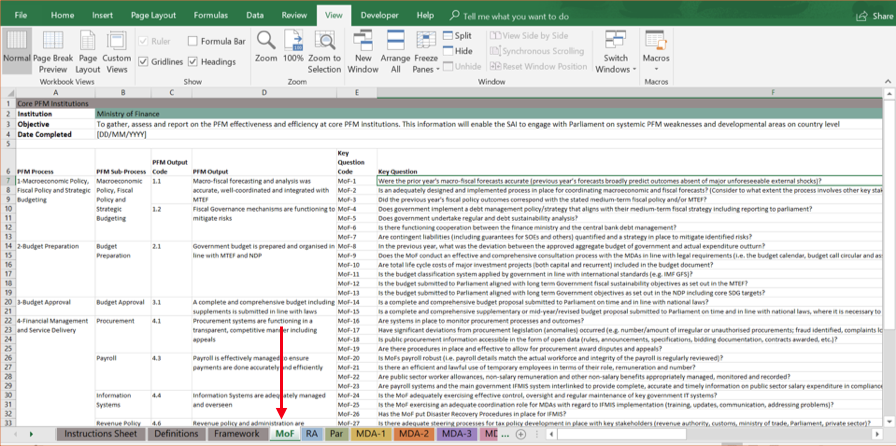
- Institution Tabs: There is one data collection tab for each institution. This is where you will review the questions relevant to the institution you are auditing and enter the appropriate responses.
- Other Tabs (Dashboards, Data, Ref-Mapping, File Names): These tabs are for analyzing the data after the data from all assessed institutions has been consolidated.
Entering Data into a Protected Worksheet
You will be working in a protected worksheet. This means that you have the ability to edit some parts of the worksheet but not others. This ensures that critical formulas and configuration, which will enable analysis of the entered data, cannot be accidentally altered during the data entry process. The details are as follows:
- Editing cells: You can enter text into columns G, H, I, J, L, and R. You can select from the drop-downs in columns K, N, and Q.
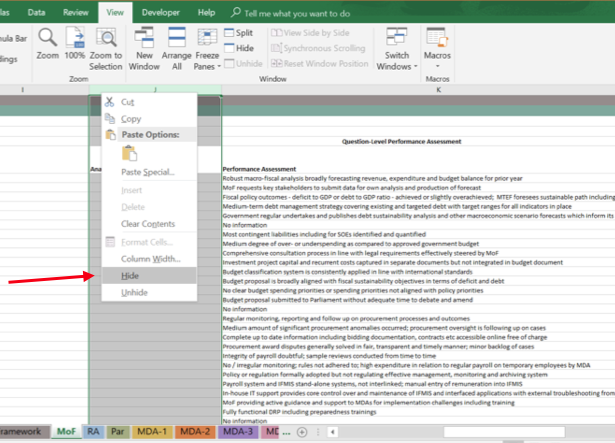
- Hiding columns: This is possible in the protected worksheet and may be helpful in the data entry process. For example, if you want to be able to see the Key Question in column F next to the Performance Assessment in column K while you are populating the Performance Assessment column, you could hide columns G, H, I, and J. To hide and unhide the columns, the steps are as follows:
- Select (highlight) the column(s) you want to hide, right click on the column(s), and select “Hide”. The column(s) will disappear from view.
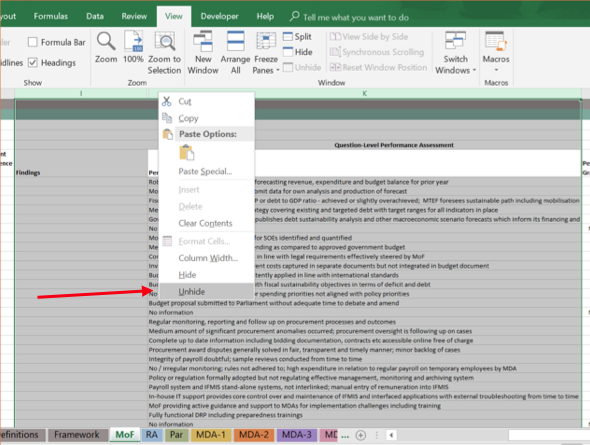
- To unhide the column(s), select (highlight) the columns on either side of the hidden column(s), right click on these columns, and select “Unhide”.
- Auto-fit row height: The row height will automatically adjust to fit the text that you have entered into the cells in columns G, H, I, J, and L. This will allow you to see and review all the text that has been entered within the cell.
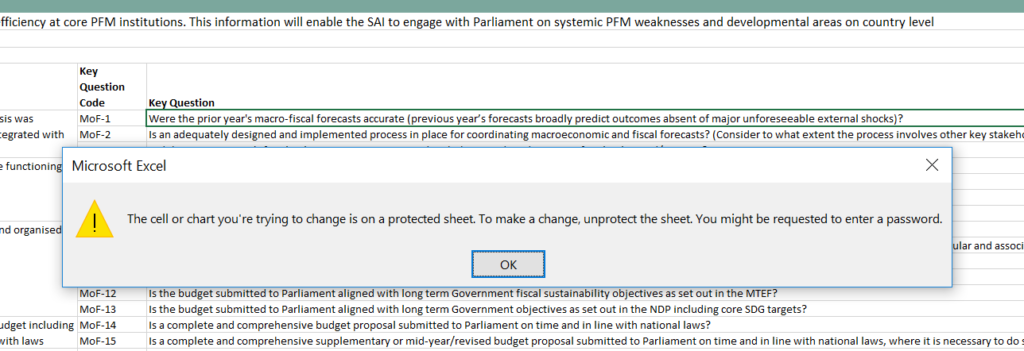
- Locked cells: If you try to edit a cell that is locked and cannot be edited, you will get an error message. For example, if you try to edit one of cells in the Key Question column, you will be informed that the cell is on a protected sheet as shown below:
Instructions
1. Open the workbook and find the appropriate tab for data entry.
Each institution has its own tab in the PFM Reporting Framework workbook. Find the tab for the institution that you are auditing and click on this tab. For example, if you are auditing the Ministry of Finance, click on the MoF tab.
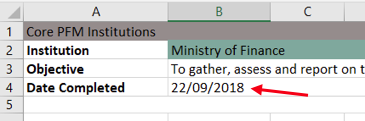
2. Enter the date that you are starting the audit in the top left corner (cell B4).
3. Enter responses for each Key Question (listed in column F).
All responses for each Key Question should be entered in the relevant columns in the same row as that question according to the following guidance:
Section 1: Basis of Assessment
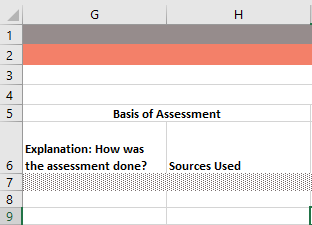
Explanation: How was the assessment done (column G): Click on the cell and enter the response.
Sources Used (column H): Click on the cell and enter the response.

Section 2: Question-Level Performance Assessment
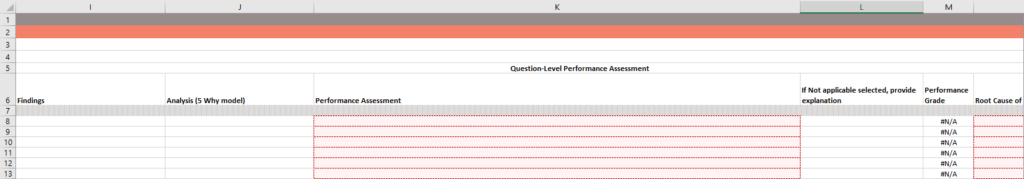
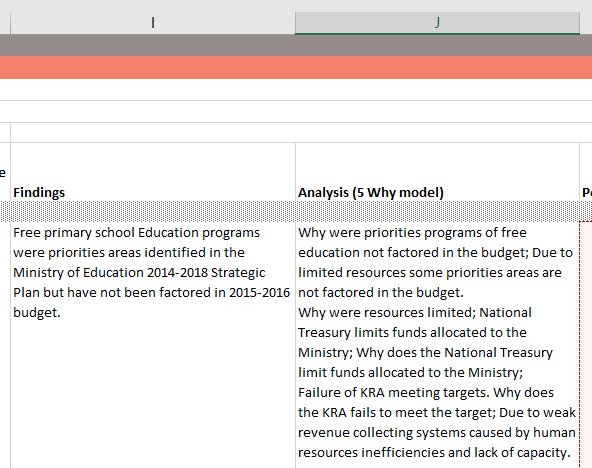
Findings (column I): Click on the cell and enter the response.
Analysis (5 Why model) (column J): Click on the cell and enter the response.
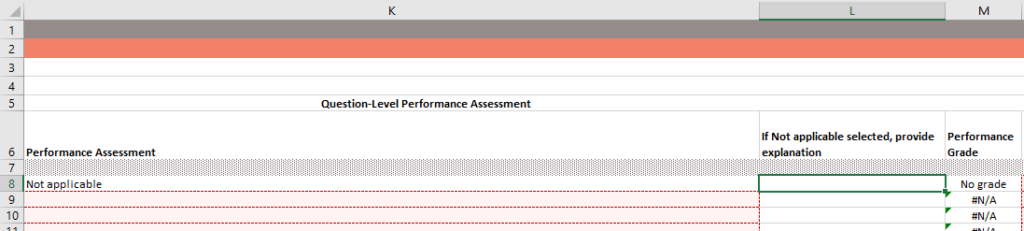
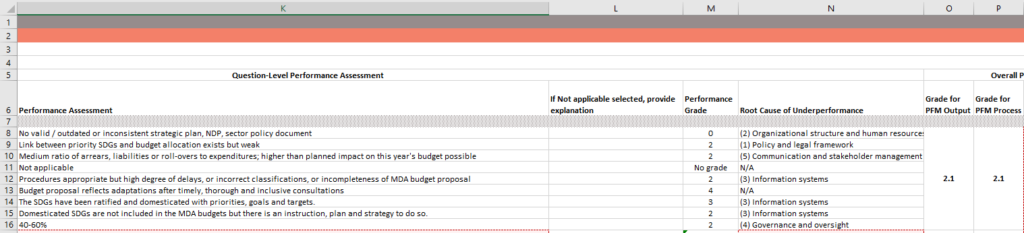
Performance Assessment (column K): Click on the cell and select the appropriate response from the drop-down. The Performance Assessment needs to be entered for all questions. If it is not possible to assess a question because it is not applicable, select “Not applicable” from the drop-down. Do not leave it blank.
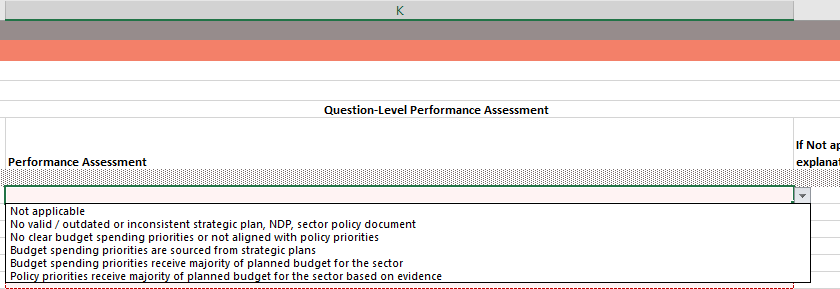
After selecting a response, the Performance Grade (column M) will automatically populate.
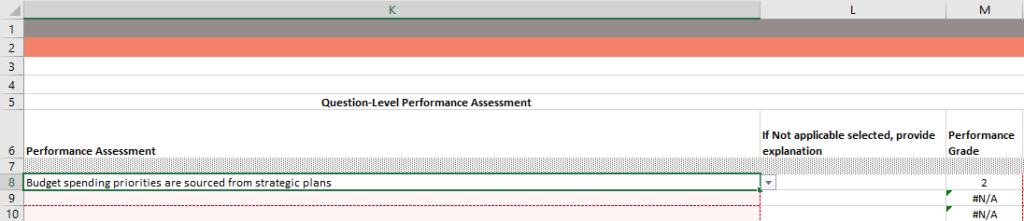
If Not applicable selected, provide explanation (column L): If not applicable is selected in column K, then an explanation must be provided in this column.
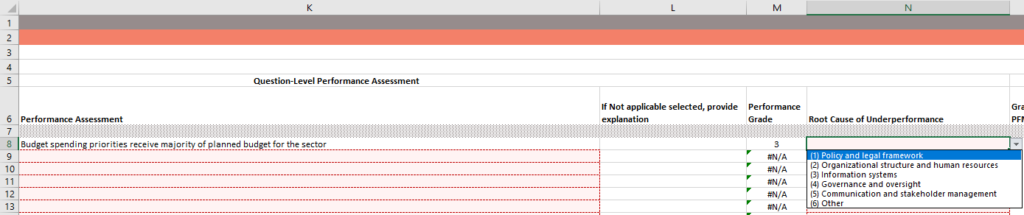
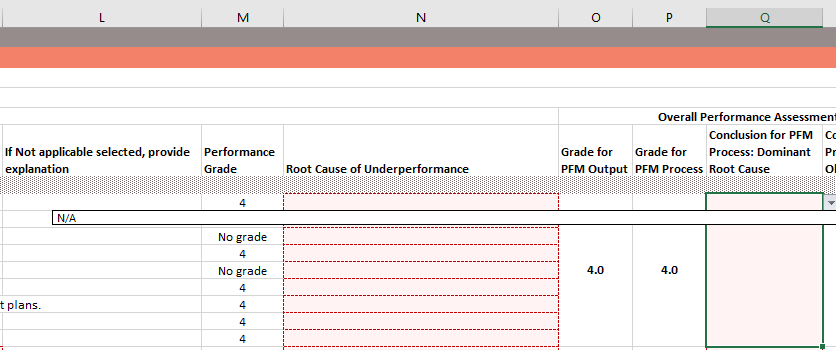
Root Cause of Underperformance (column N): If the Performance Grade is 0, 1, 2, or 3, click on the corresponding cell under Root Cause of Underperformance and select the appropriate response from the drop-down.
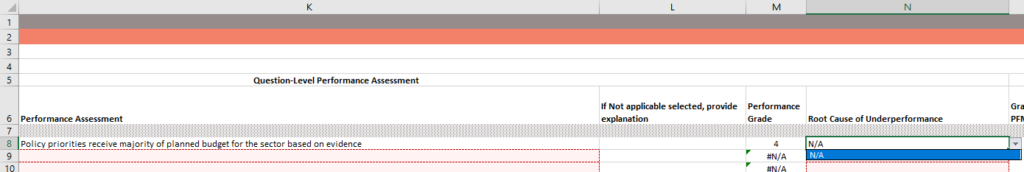
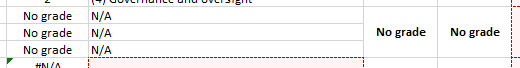
If the grade is “No grade” or 4, click on the corresponding cell under Root Cause of Underperformance and select “N/A” from the drop-down.
Example with grade of 4:
Example with grade of “No grade” due to selection of Not applicable:
Section 3: Overall Performance Assessment
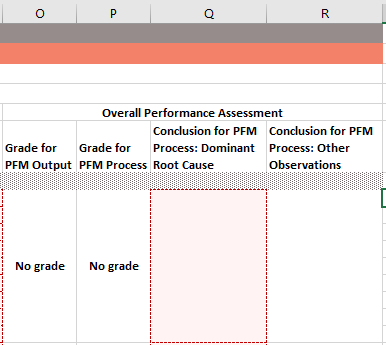
Grade for PFM Output (column O) and Grade for PFM Process (column P): The grades in these columns will automatically populate. The Grade for PFM Output is the average of all the Performance Grades for all Key Questions under that output. The Grade for PFM Process is the average of all the Performance Grades for all Key Questions under that process.
If there is a Performance Grade of “No grade” for all Key Questions under an output or process, the grade for that output or process will be “No grade” as well.
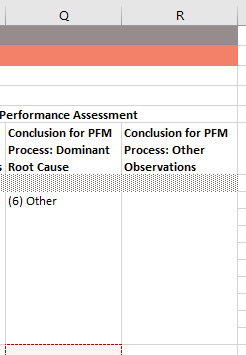
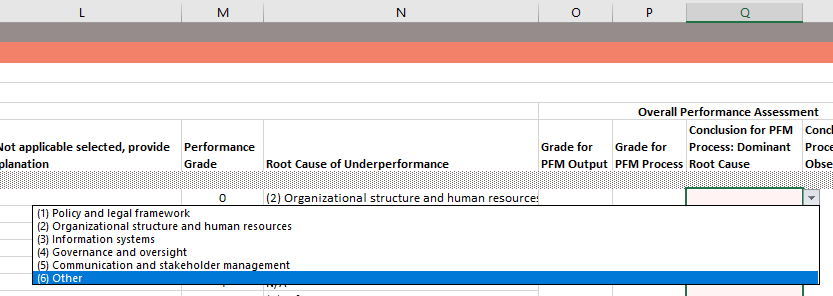
Conclusion for PFM Process: Dominant Root Cause (column Q): Click on the cell and select the appropriate Dominant Root Cause of Underperformance for each Process from the drop-down.
If the Grade for PFM Process is “No grade” or 4, click on the corresponding cell under Root Cause of Underperformance and select “N/A” from the drop-down.
Conclusion for PFM Process: Other Observations (column R): Enter any relevant observations for the PFM process in this column. If “(6) Other” is selected under Dominant Root Cause (column Q), then please provide an explanation for why this was selected.